Cool
Average highs are around 17°C, so pack for cooler days.
Weather Guide
Best months: July, August, June
Across the year, average daytime temperatures are around 16°C, sunshine averages 5h per day, and rainfall totals about 685mm.
Annual averages
Temp
16°C
Rain
685mm
Annual total
Sun
5h
Weather score
39
Poor avg
Cool
Average highs are around 17°C, so pack for cooler days.
Drier
Rainfall averages 59mm, which is relatively low for holiday planning.
Limited sun
Sunshine averages 4.2h per day, so this is not one of the brighter months.
Map
Compare Loire Valley, France with nearby places by weather score, rain, sun, temperature, and swim conditions.
October17°C average high
October is close to Loire Valley's yearly temperature average, giving a typical read on daytime heat.
Warmest monthsJune to September
This stretch sets the upper range for average daytime heat.
October59mm average rain
October is close to Loire Valley's usual rainfall pattern, with little seasonal change across the year.
Driest monthsAll year
Rainfall stays comparatively low through the year.
October4.2 hours average sun
October sits close to Loire Valley's yearly sunshine average, so it is a middle-of-the-pack month for bright days.
Brightest monthsJune to August
This stretch has the strongest sunshine in the monthly averages.
October34 weather score
October scores below Loire Valley's yearly average, so the weather trade-offs are more noticeable.
Best weather monthsJune to August
These months have the strongest weather score in the monthly averages.
 Moxy Paris ClamartClamart, France
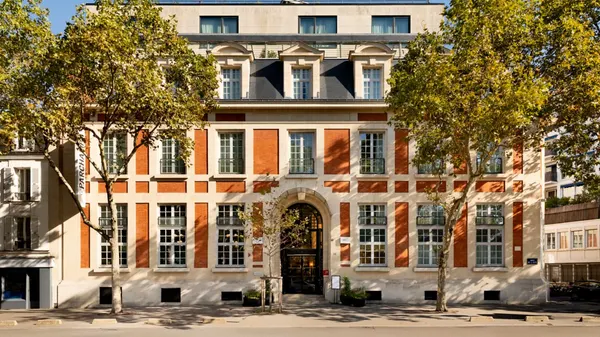 Le Parchamp, Paris Boulogne, a Tribute Portfolio HotelBoulogne Billancourt, France
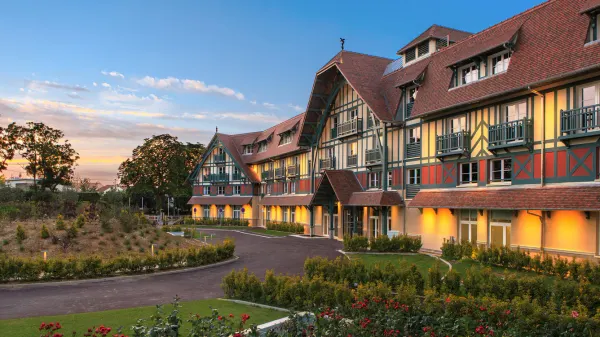 Renaissance Paris Hippodrome de St. Cloud HotelRueil-Malmaison, France
 Courtyard Paris Porte de VersaillesIssy-les-Moulineaux, France
 Courtyard Paris ArcueilArcueil, France
 Residence Inn Paris Didot MontparnasseParis, France